Upon logging into Trellis, the dashboard is shown. The dashboard enables you to view key metrics calculated from the data in your inventory in various ways, as well as drill down through facility groups, facilities, and meters.

Filtering
The controls at the top of the dashboard are used to filter the data being reported on.
![]()
From left to right, the filtering controls are:
-
Date - Set the date range of the data reported on.
-
Resource - Limit data to any one resource type, or report over all resources.
-
Location indicator - Shows the current inventory, facility group, facility, and/or meter being viewed. Each level is a link which allows navigating back up the hierarchy.
-
Search button - Displays inventory structure as a searchable, expandable tree.
The dashboard search options and reporting filters are populated based on available data within the selected date range. This means:
- Filter dropdowns only show options where data exists for the selected period
- Search results only include entities (facilities, meters, etc.) that have associated data in the selected timeframe
- Selecting "All" resources will only show resources that have associated data, not all configured resource types
This approach ensures that your filtering and search options always lead to meaningful results with data to display.
Widgets
All elements of the dashboard, or "widgets," report on the set of data in the active inventory which matches the specified filters. Some widgets have shortcut links to the reports from which they draw their source data.
Comparison to previous period
Displays a chart comparing cost, energy, emissions or resource consumption from the current to the previous period. The tabs allow the displayed metric to be selected and show an average daily figure for the current period and the percentage difference to the same month in the previous period. The chart may be switched between a line and a bar chart using the icons on the top right of the screen.

Data Coverage
Shows the percentage of the selected date range which has already elapsed compared to the percentage of the selected date range covered by source data. The time elapsed is represented in orange and completeness in green.
-
Elapsed: The time elapsed from the start of the selected date range to current date.
-
Complete: The overall data completeness percentage across all meters.
For example, a site with quarterly billing will have had two bills issued at the end of the third quarter, with the bill for the third quarter expected shortly afterwards. In this case, with the date range filter set to the current year, the time elapsed will be 75% while the completeness will be at 50% as two of the expected four bills have been issued.
The data coverage wheel will show different information if Estimations are enabled in the view. Learn more about Estimations and how to set up your data to support that view option.

Summary Data
Provides a quick summary of activity occurring within the date range selected.

Top Facilities
Displays the top 10 facilities ordered by the metric selected via the tabs, Selecting a facility name will drill down to that facility.

Drill Down
Drills down through facility groups, facilities, and meters, which are displayed in a size proportional to their contribution towards the metric selected using the tabs.

Facility Locations
Displays on a map facilities which have been assigned a location. Selecting a pin shows the facility name and a street view image, as well as a link drilling down to to that facility.

Each facility location pin will only appear on the map when there is some data allocated to at least one meter within it.
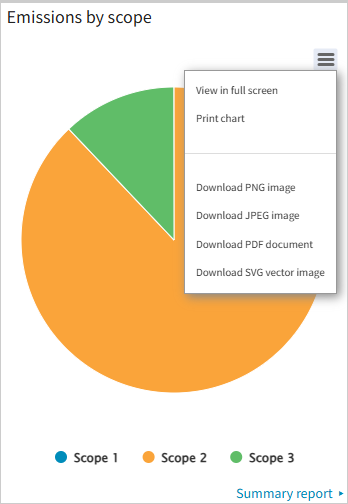
Emissions by Scope
Shows the proportion of scope 1, 2 and 3 emissions.