
To help you analyse data efficiently, Trellis offers eight standard reports and additional tailored reports for customers with specific features enabled. You can also add additional fields to any of the available reports, and save them as favourites to be available to you only or other users with access to the inventory.
Key Topis Covered
Standard Reports
-
Data Coverage Report - Show data received, expected, and missing for each meter.
-
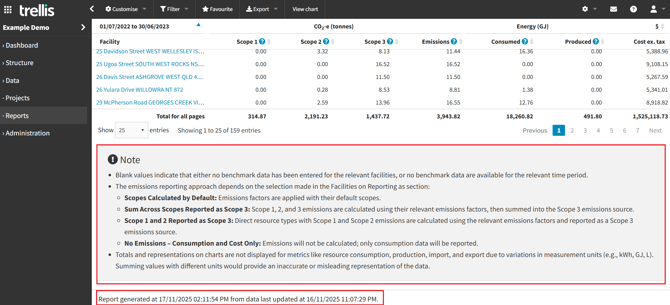
Summary Report - Report on emissions, energy, cost, and consumption for a single period.
-
Electricity Production Report - Report on electricity generation, import, export, and total consumption.
-
Periodic Report - Report on cost, consumption, or emissions over time.
-
Year-on-Year Comparison Report - Compare cost, consumption, or emissions by month over multiple years (requires consolidated inventory).
-
Baseline Comparison Report - Report on absolute and relative changes to one of cost, consumption, or emissions from a specified baseline period.
-
Bill Exceptions Report - Shows difference between current and previous bills.
-
Factor Sources Report - View the sources of the factors used to calculate your emissions.
Tailored Reports (accessible as part of add on features)
-
Invoice Approval Report - Report on invoice approval status.
-
Interval Data Verification Report - Verify billing data against interval data readings.
-
NGER Report for EERS Data Entry - Reports on data applicable to an NGER report, structured for entry into the EERS system.
-
TEFMA Report - Report on energy consumption and greenhouse gas emission, categorised by TEFMA standards.
To view and access the tailored report for your needs contact our support team.
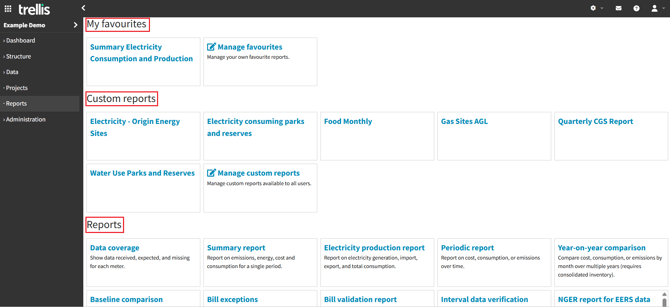
Accessing Reports
- Navigate to the "Reports" tab from the sidebar menu.
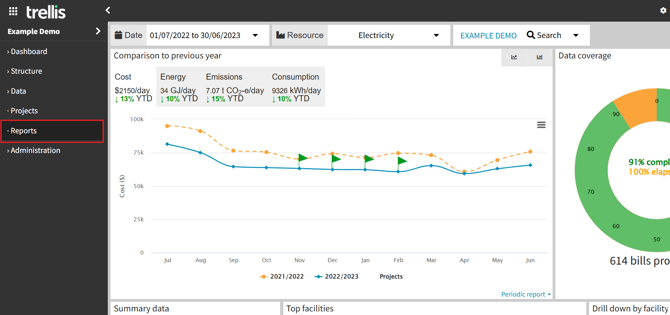
- The Reports page displays all the standard and tailored reports you have access to, as well as any favourite / custom reports created.
Customise
Each report is fully customisable. This can be done by clicking on the "Customise" button located on the top navigation bar of each page. Depending on the specific report you are working with, different customisation options may be available.
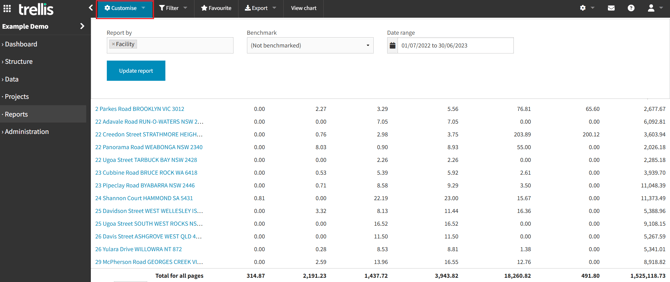
Modify the report based on your requirements. Options including but not limited to:
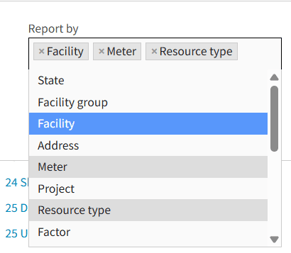
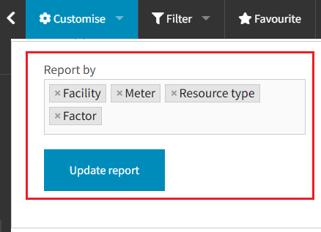
- Report By: Facility, meter, factor, resource type, etc. Defaulted to Facility in most of the reports.
The options available here will generally reflect various levels of your structure that can be used as dimensions, and if applicable, may include custom fields you have added to meters, facilities and facility groups
-
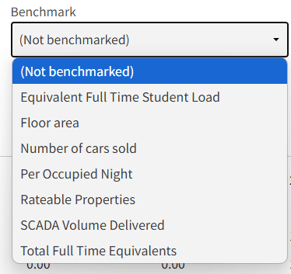
Benchmarks: User defined business metrics which can be used in reports to normalise and compare values. Read more about how to add and use them in the dedicated article.
-
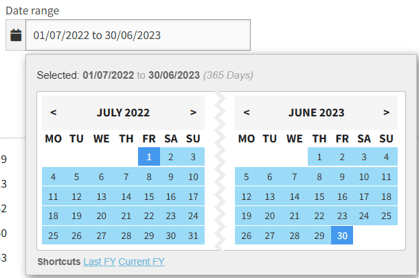
Date Range: Specify the period for the report. Defaulted to the current financial year (FY) in most of the reports. Smallest reporting interval is 1 month. Selection will default to the start and end days of the month of a selected date range.
Filter
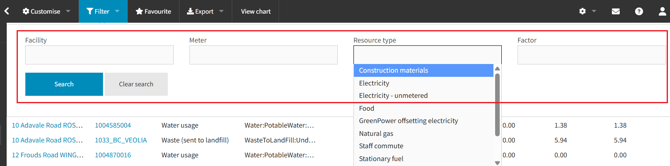
Most reports include a filtering option, accessible by clicking the "Filter" button at the top of the page. Adjust the filters to only display the data you need.
Filter visibility is dynamic. The available filtering options may vary depending on your customisation selections. In many reports, the choices you make in the "Report by" section will determine which filters are displayed.
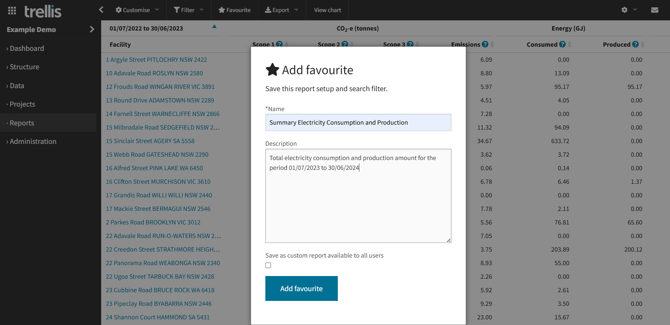
Saving a Custom Report
If you want to save and reuse the selected configuration in a customised report, click the "Favourite" button. Using favourites will allow you to quickly access frequently used configurations without reapplying changes each time.
-
Provide a clear name and an optional description for future reference.
-
Choose to save the report for yourself or make it available to all Trellis users in your organisation.
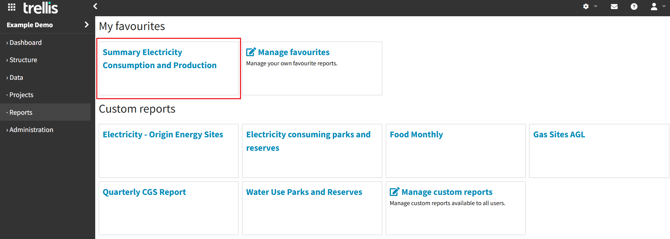
- Once saved, you can find your custom reports in the "My favorites" section, or "Custom reports" (if checked the "Save as custom report available to all users" box) on the Reports page.
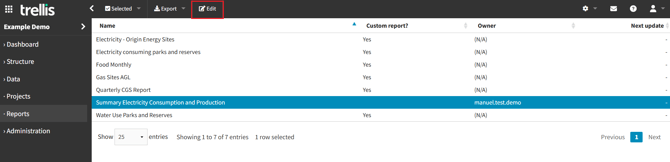
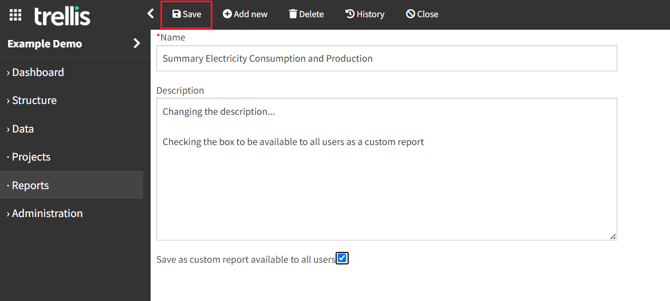
- To modify a saved report, go to Manage favorites / Custom reports, select the report, click the Edit button, make changes, and click Save.
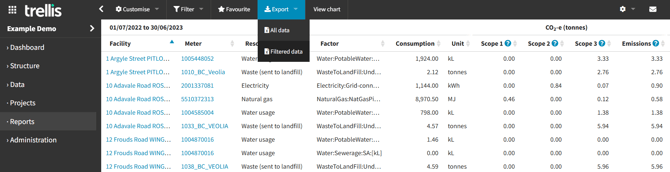
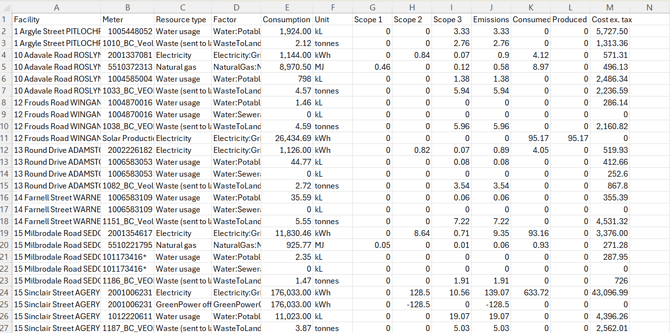
Export
Export your reports for further analysis by clicking the "Export" button in the top navigation bar and selecting one of the options to export either all or your filtered data. This will provide you with a detailed csv.
-
All data will output the full contents of your inventory applicable to this report
-
Filtered data will output the records in the current table view (from all pages)
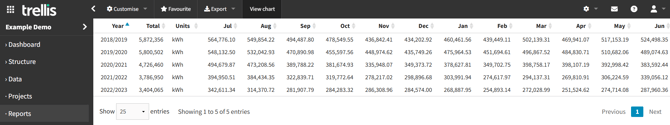
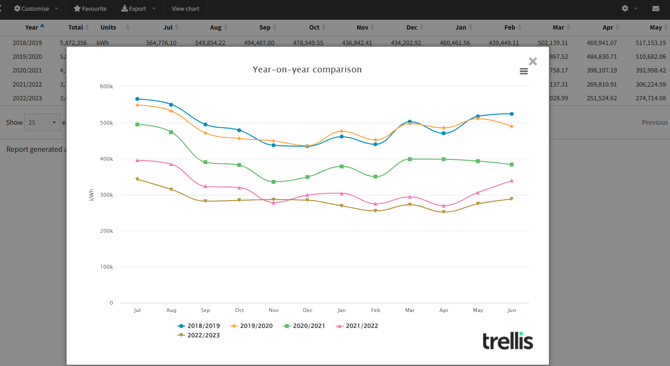
View Chart
Some reports have a "View chart" button which allows you to visualise the available data set in a preformatted graph.
Below is an example from the Year-on-year comparison report comparing the resource consumption trends throughout different years:
Notes and Configurations
-
Most of the reports have a "Note" section at the bottom of the page including extra information regarding each report.
-
There is also a note at the bottom of each page showing the last time that report has been updated.
“Why can’t I see x in the report?”
-
Overnight, Trellis processes and prepares data to be made available in the dashboard, and various report structures.
-
If you change any configurations in the web app, such as configuring meters for estimation, or manually uploading data to your inventory, the updated values will appear in reports and dashboard the following day